Do the top seeds in the grand slam tournaments hold their own in the present century ?
Hello,
Welcome to this seventh tennis post. For better visibility, I advise you to look at my posts on a computer (for the size but also because the colors differ on a phone that has a dark theme like me. If the theme is light, only the size makes it difficult to read).
Today, a visualisation on the performances of the top seeds in Grand Slam tournaments in the 21st century. By performance, I mean reaching the 3rd round of the tournament.
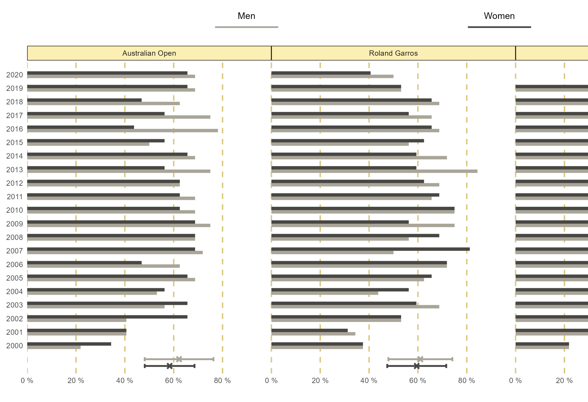
The Australian Open is currently being played, and we can see that in the women's draw, many top seeds did not reach the 3rd round (in this round there are 32 players remaining, knowing that there are 32 seeds at the start of the tournament). Nevertheless, 2 top seeds can only meet at from the 3rd round, hence the interest of the subject !
Taking the example again, this year 12 top seeds reached the 3rd round in the women's draw, and 23 in the men's draw. It was this result that gave me the idea to see what the proportion was in each of the 4 Grand Slam tournaments since the 2000's. I limited myself to the interval 2000 ➜ 2020 for dataviz size reasons principaly, but the result will still be interesting in my opinion.
In the dataviz below, this proportion is therefore represented for the 4 tournaments, for women and men, with each time, the indication of the mean with its standard deviation in order to understand the dispersion of the values (the larger the horizontal bar, the more irregular and far from the mean the values are).
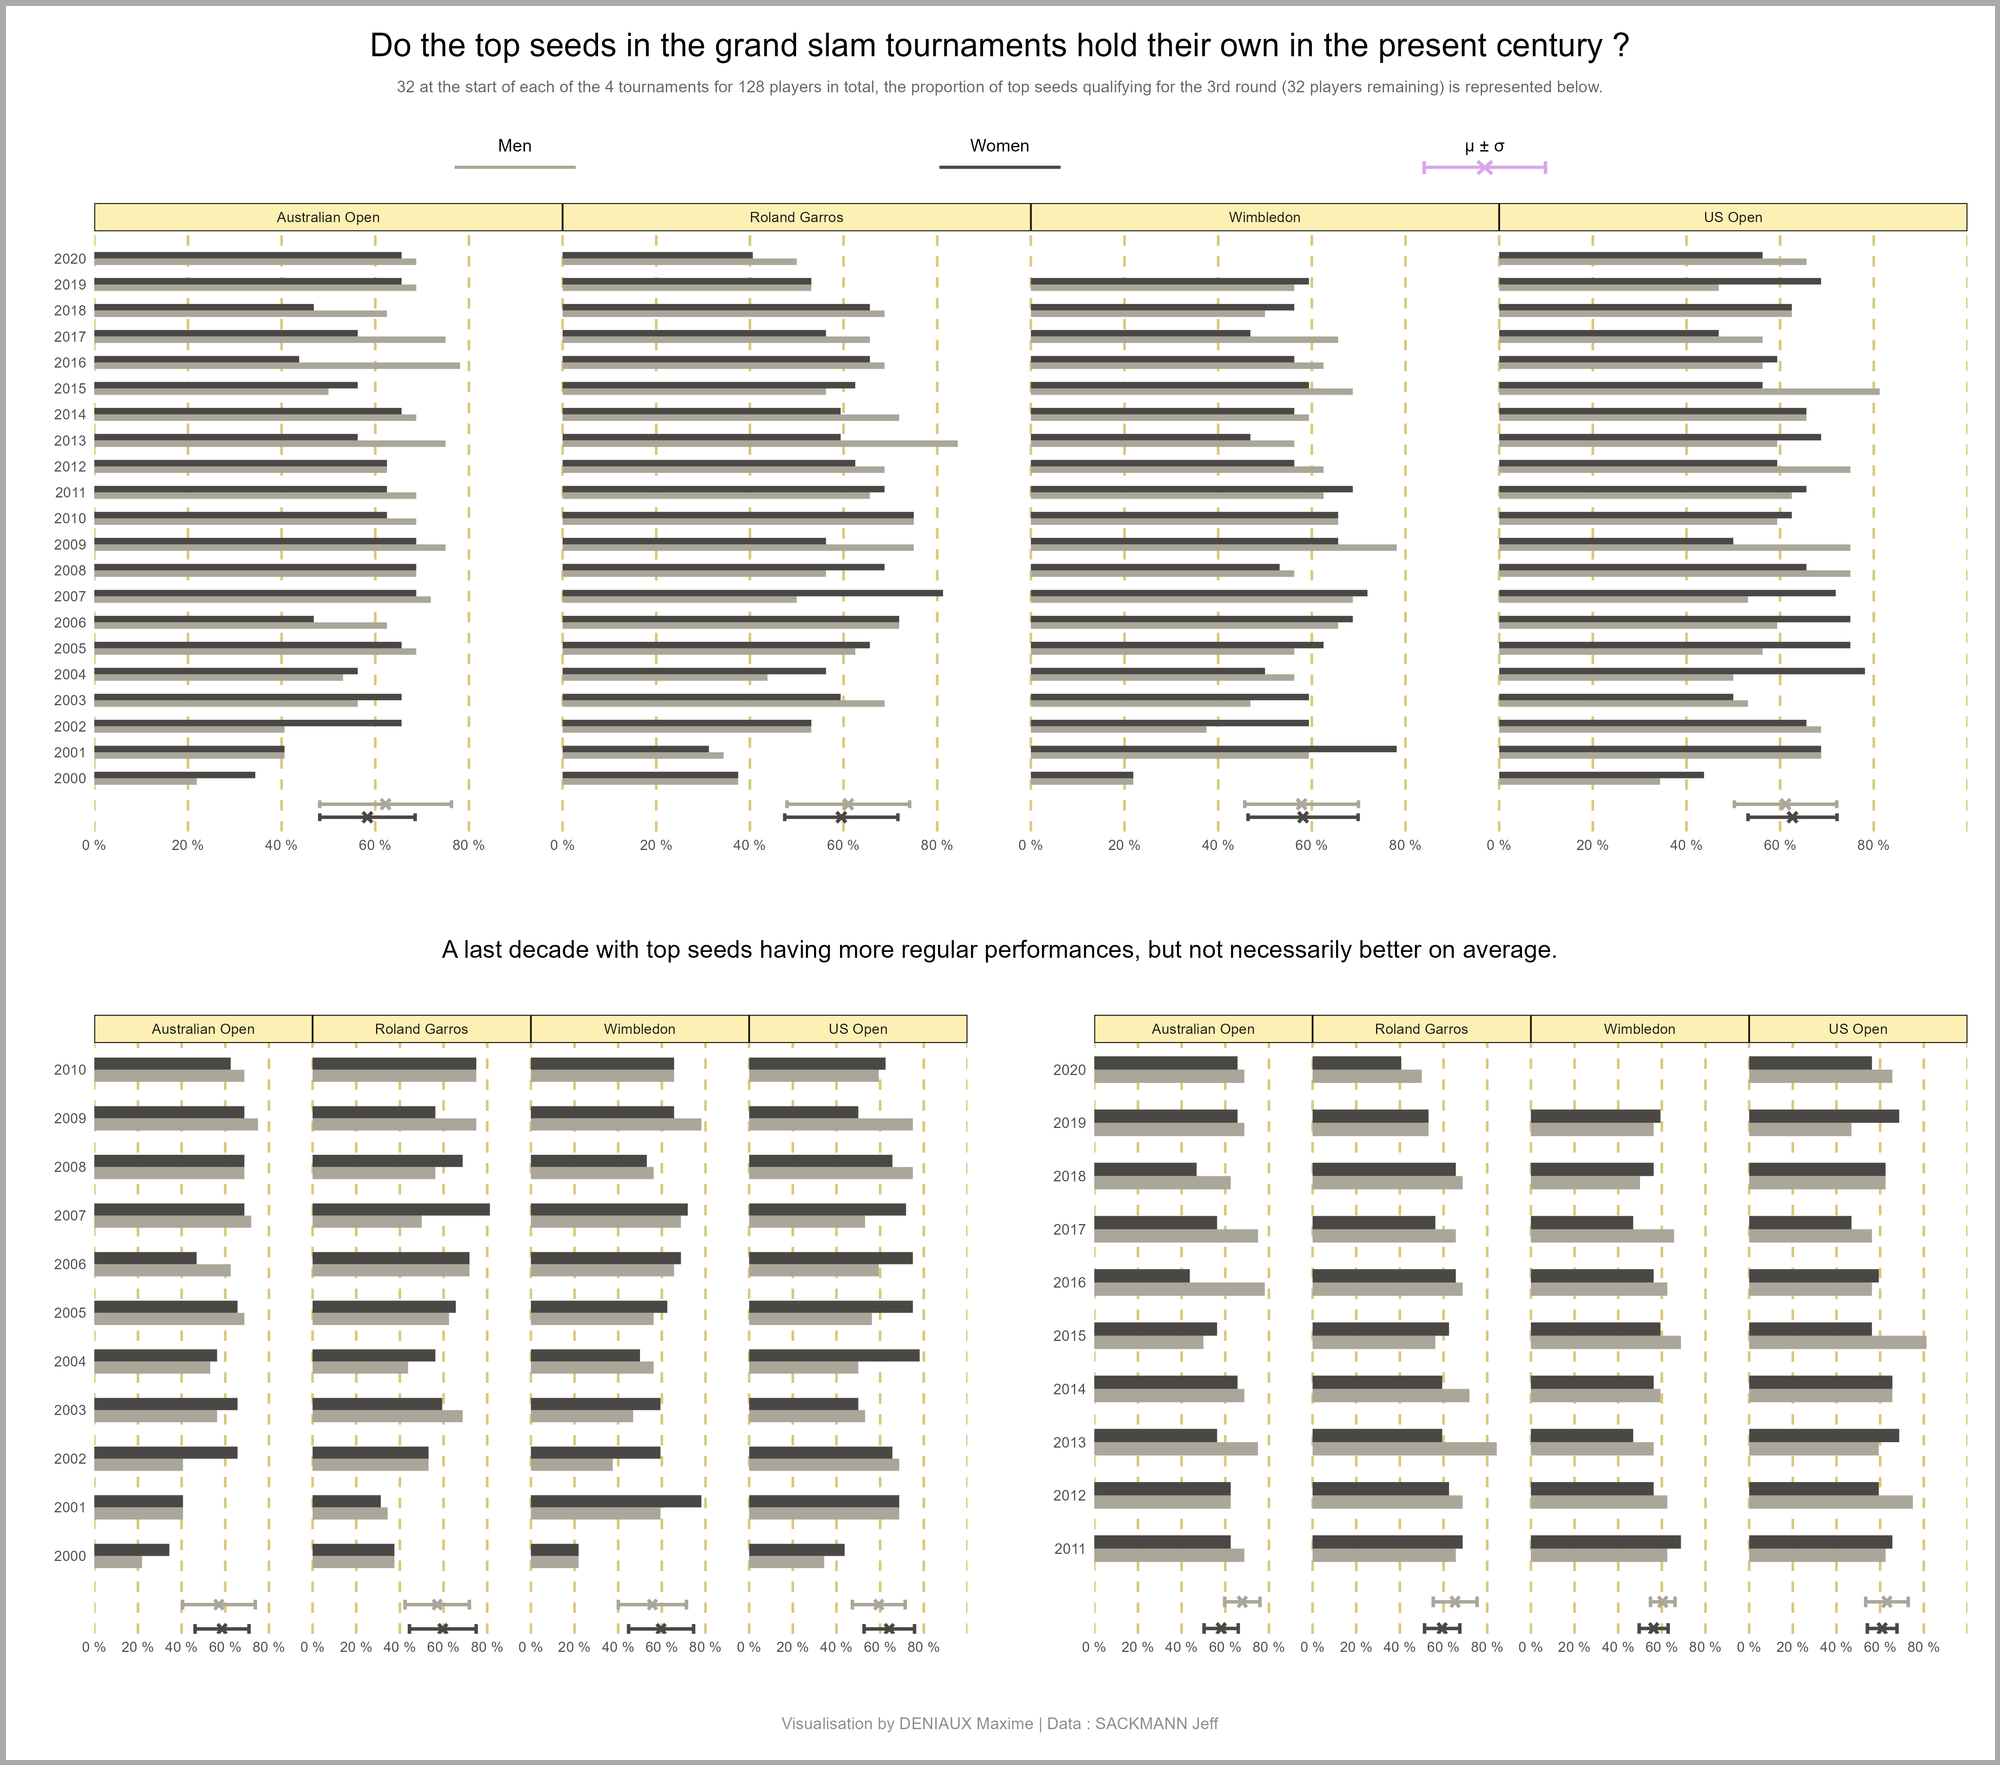
Overall, on the top graph, we can see that the means, for men and women, are often close. Around 60 % of top seeds qualify for the 3rd round in each tournament. We can possibly note that the dispersion of values is bigger among men (we therefore find it if we look precisely at large values and small ones, causing this large standard deviation).
But in my opinion, where I find the information interesting is if we cut into 2 decades. We realize that performances are more regular over the 2nd decade (smaller standard deviations), although the average values remain close.
And this is seen in every tournament, whether for men or women.
As for the reasons why we find such values, I don't know.
It's hard to say, and probably multi-factorial.In any case, I find it an interesting and curious result. Maybe you have some ideas ? 🧐
Note that these are necessarily small samples (because of the choice of dates) so...this work has the faults of this type of choice.
Thanks for reading ! I hope it was clear and you liked it.
You will find the code below by clicking the github link button.
If you have any questions or remarks, I invite you to create an account (it's free) to write a comment, or simply to be notified of a new post in the future !
See you soon for new content 👋
 MaximeDeniaux
Comments ()