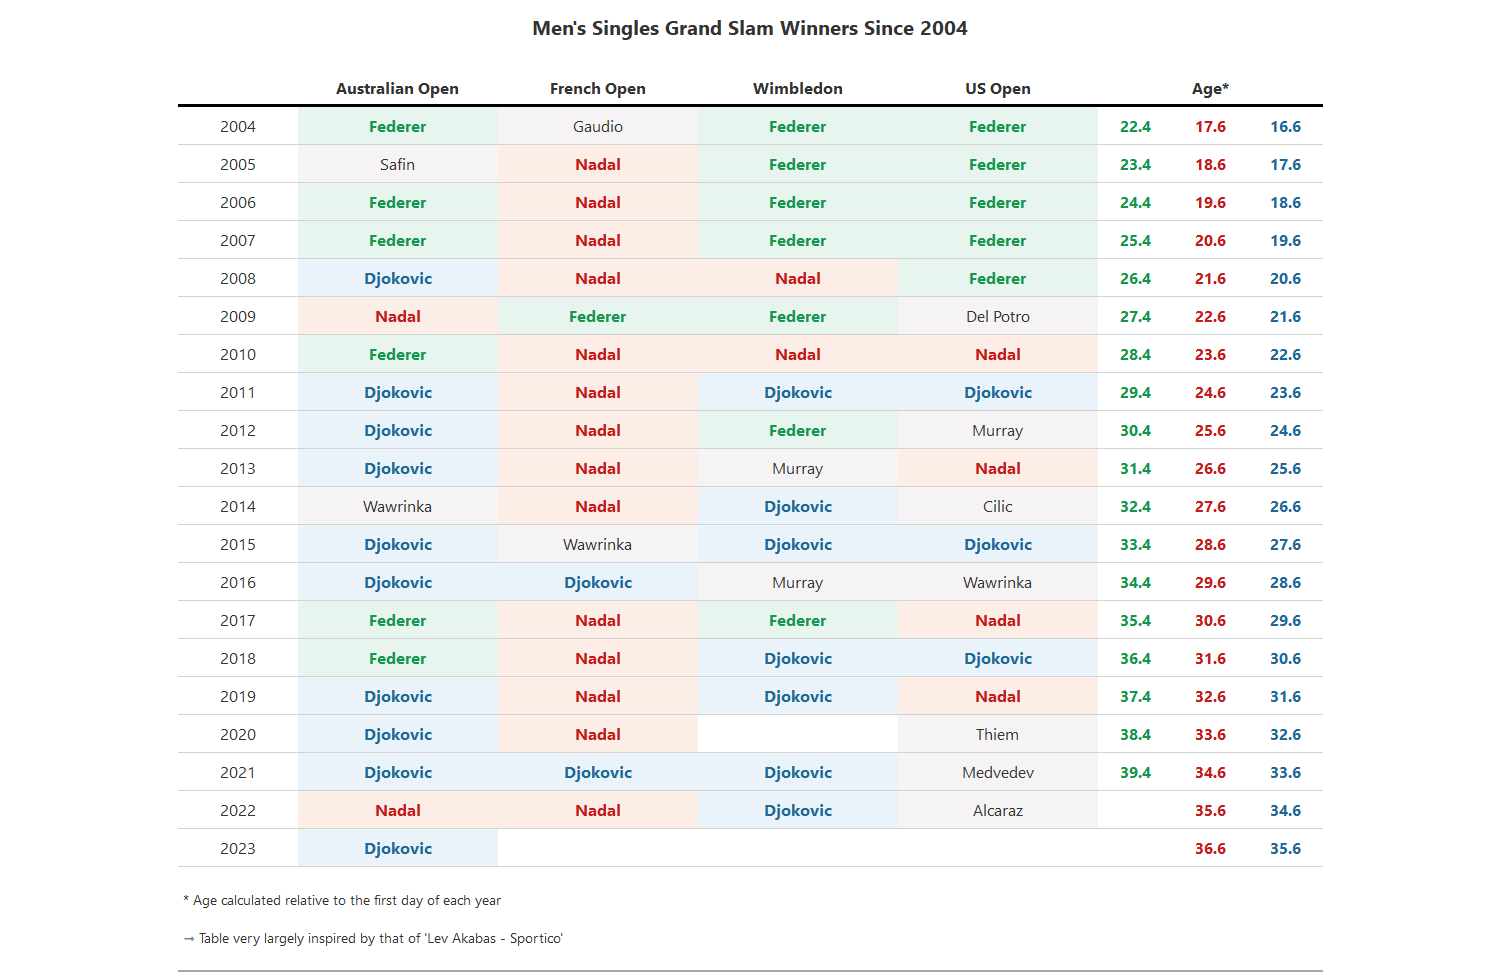
Men's singles Grand Slam winners since 2004
Hello,
Welcome to this first tennis post. For better visibility, I advise you to look at my posts on a computer (for the size but also because the colors differ on a phone that has a dark theme like me. If the theme is light, only the size makes it difficult to read).
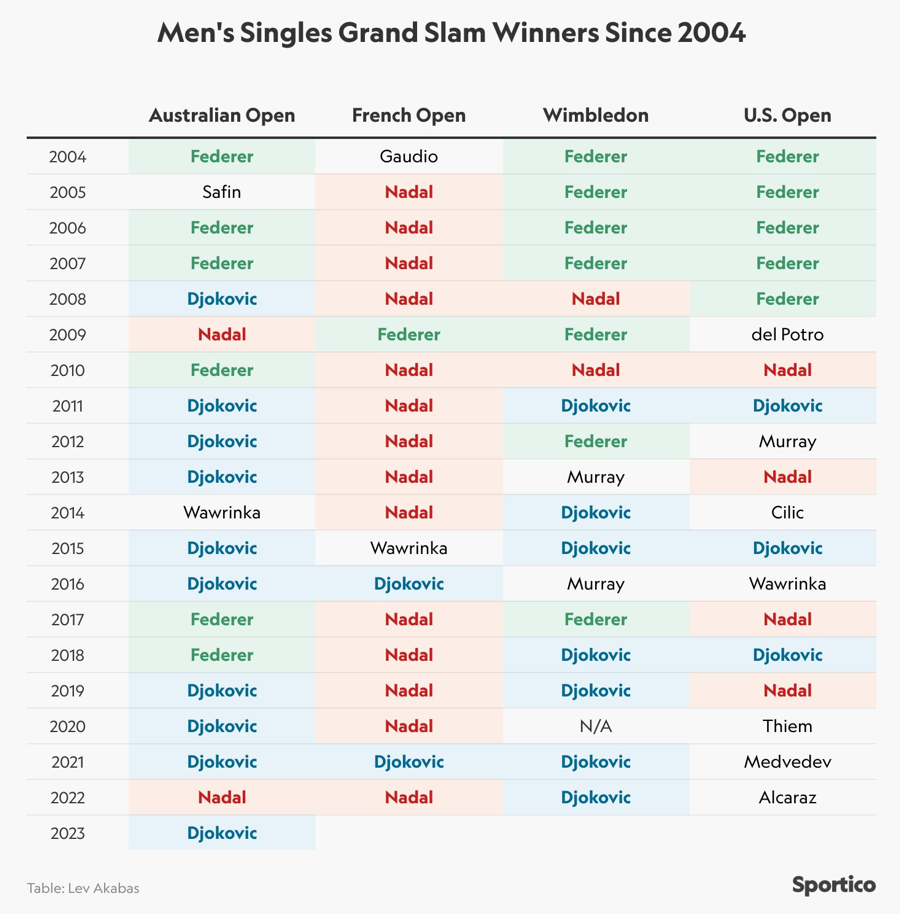
It will be about learning how to build a pretty table. The theme here will be the winners of Grand Slam tournaments since 2004. It is the reproduction of a table that already exists and built by Lev Akabas, to which I will add some information.
Below is the table he built :
Without delay, we will therefore try to build our table, with R !
Access to the code at the bottom of the page.
Let's go ! 😇
First, the data. I copied the data by hand from the table, I also give at the end of the post, in addition to the R code, a .txt file for the data.
We import the data with for example a read_delim() and we create 3 variables which are respectively the dates of birth of Federer, Nadal and Djokovic.
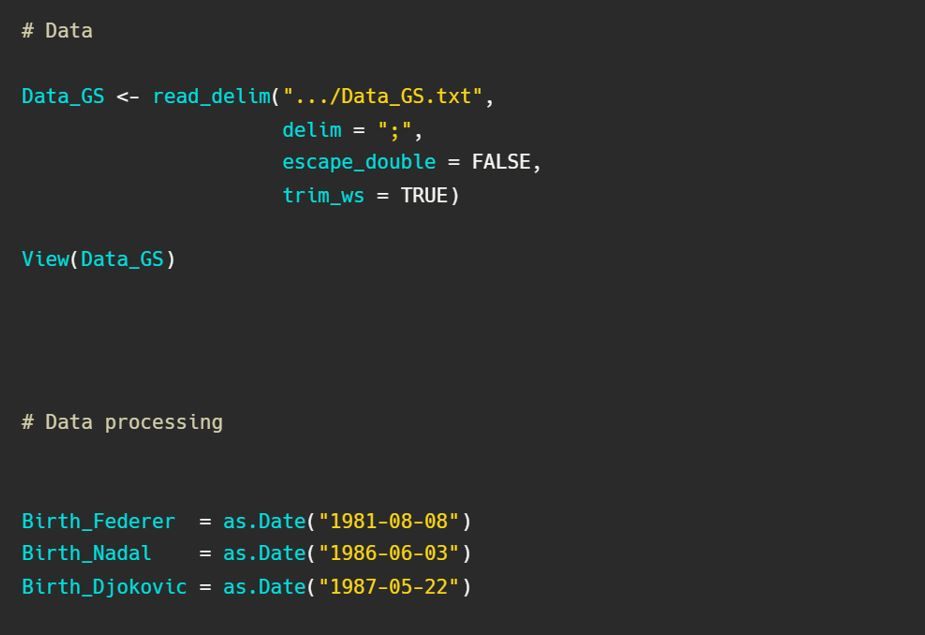
I create these 3 variables because I want to add to the Lev table, information on the ages of these 3 players each year. I think this can add value to understanding the dynamics of their results.
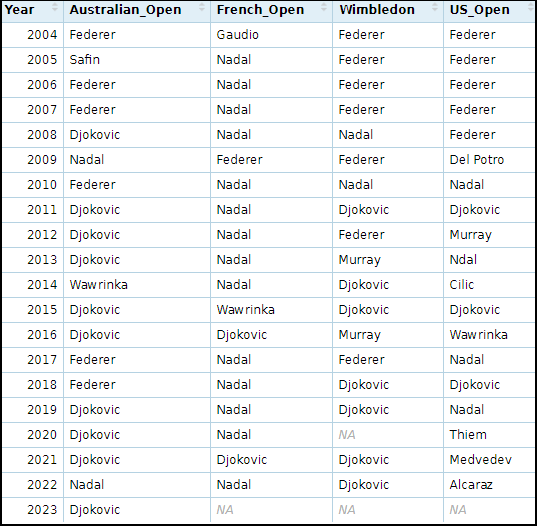
The table for now looks like :
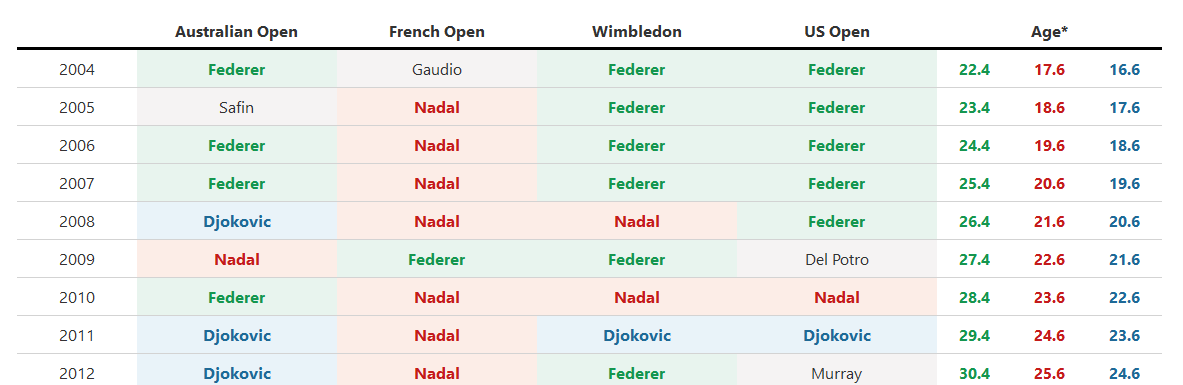
After creating these 3 variables, we can add 3 columns to our dataframe, the ages of our 3 players.The goal is to add to our dataframe the age that these 3 players were at the beginning of each year since 2004. I think this can bring added value to understanding the dynamics of their results.
To do this, we can use the lubridate package that allows you to do operations with dates.
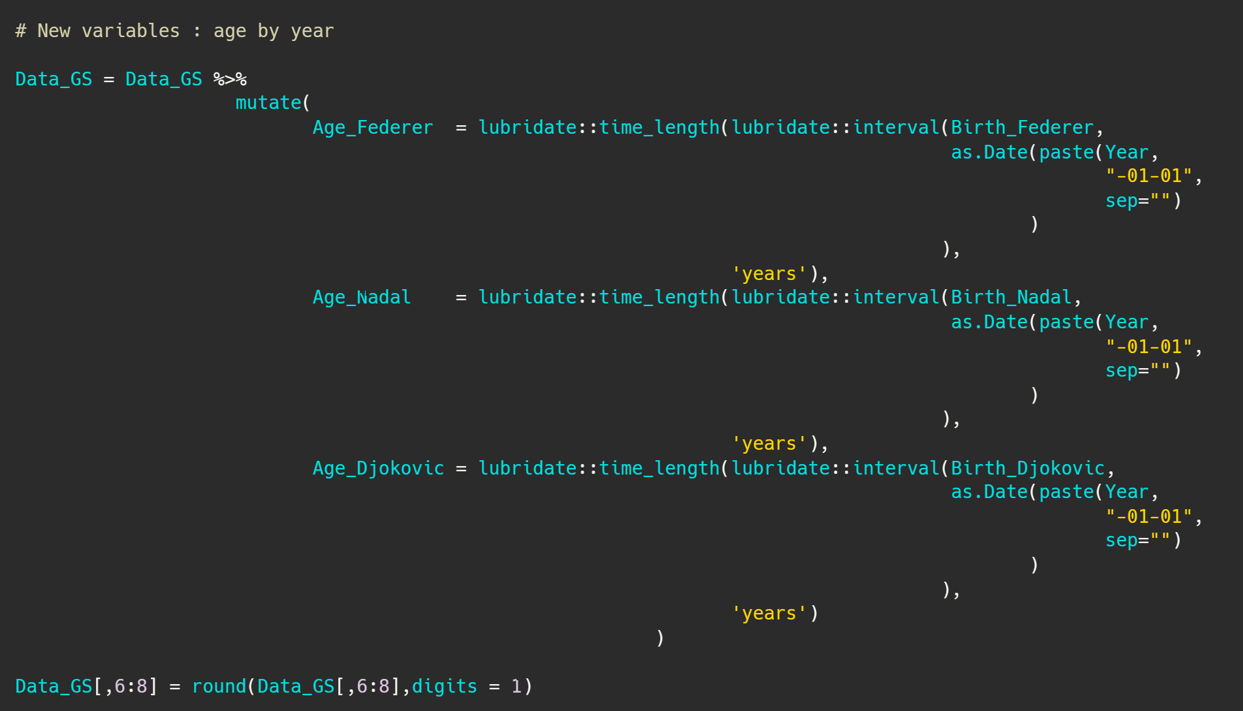
We now have all our columns, but for the sake of formatting, I will exchange the NAs for white values, and I will give white values to the Age_Federer column for the years 2022 and 2023 because it was no longer active.
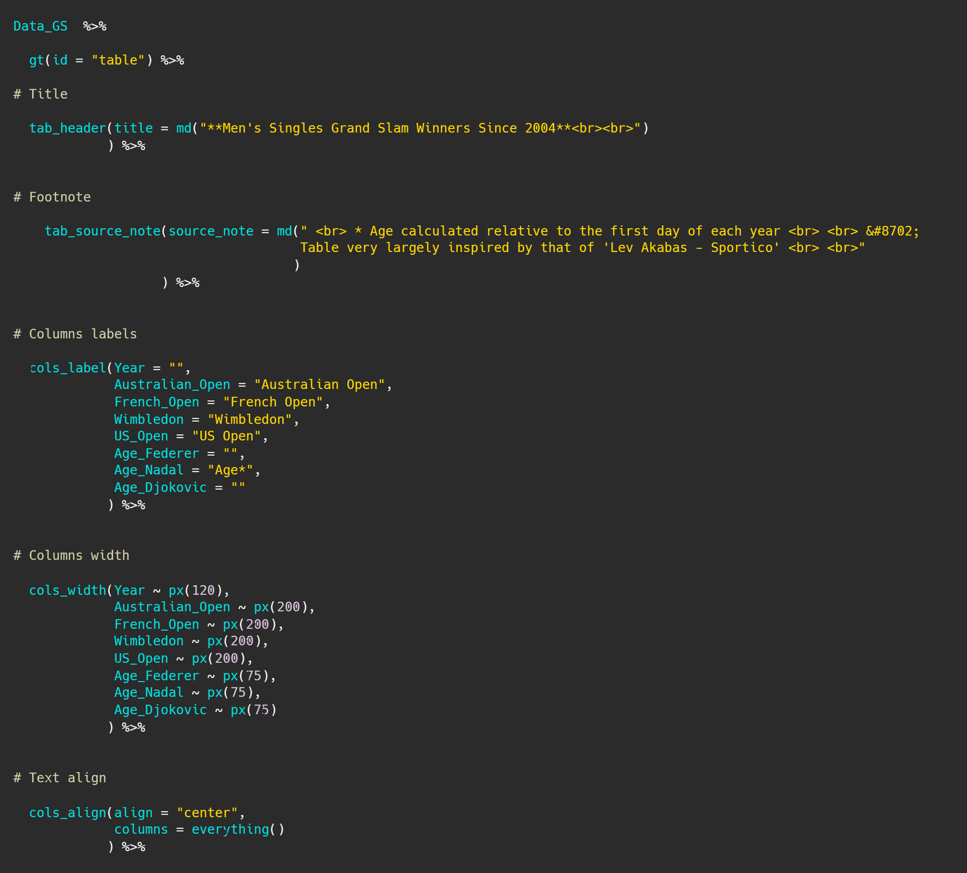
We can now create the table and customize it from a visual point of view. There are many packages to do this, such as gt, formattable, reactable, reactablefmtr...
For my part, I have been used to working with the gt package for several times, so it will be used here! The principle is quite simple, we give our dataframe and we paste the following code "%>% gt()". Thus, the object is already of type GT and you can see the rendering in the viewer.
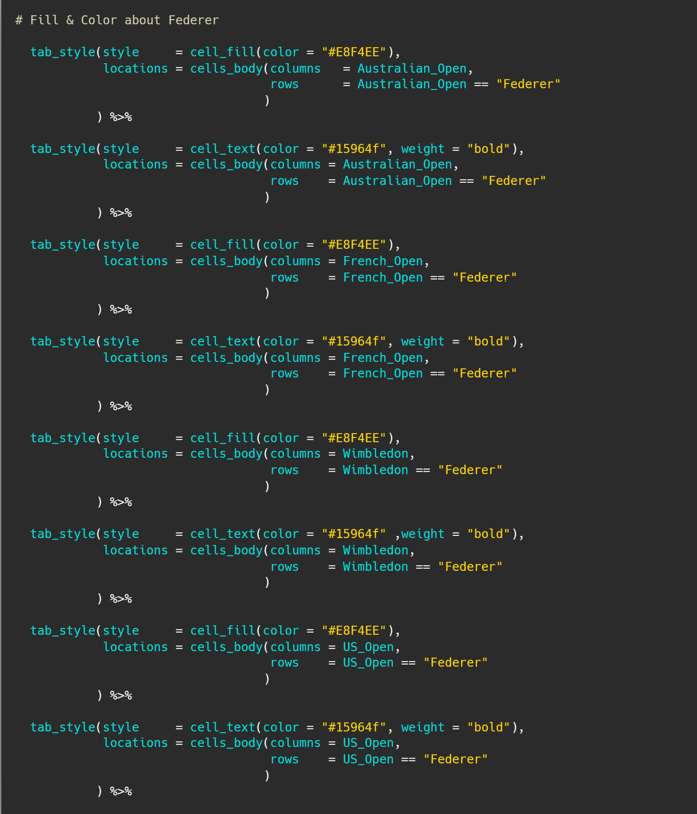
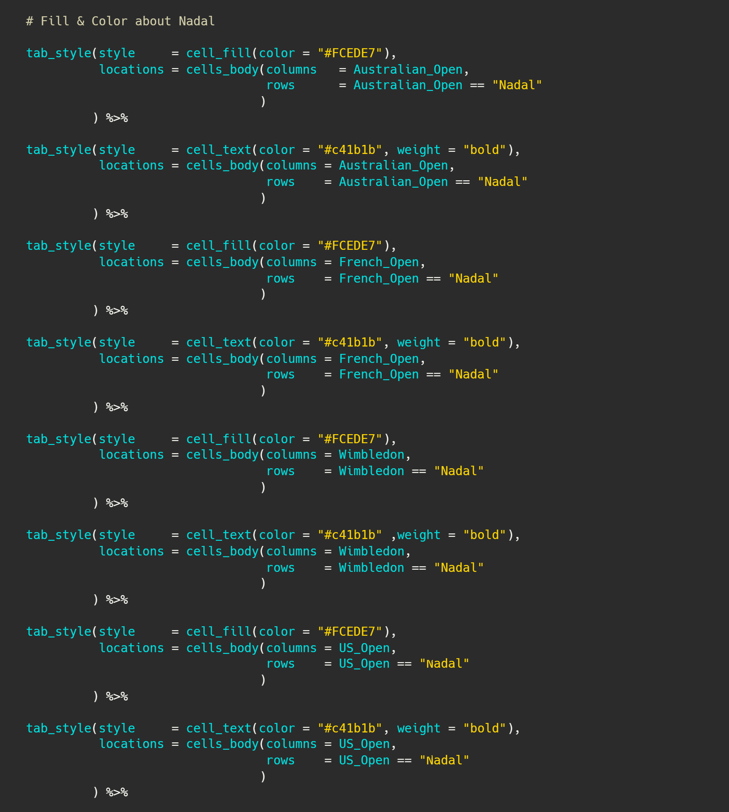
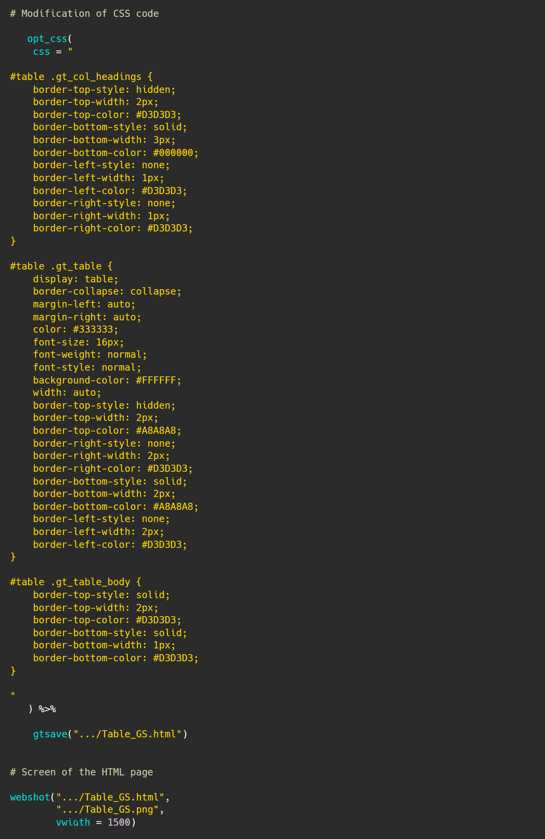
We can chain the operations with pipes, to add a title or a footnote, add column labels, define their width, center the text of certain cells, and especially add colors and many other things like customize the CSS look of the code with...css code, because the GT table is actually HTML with layers of CSS...
Thus, with the following code :
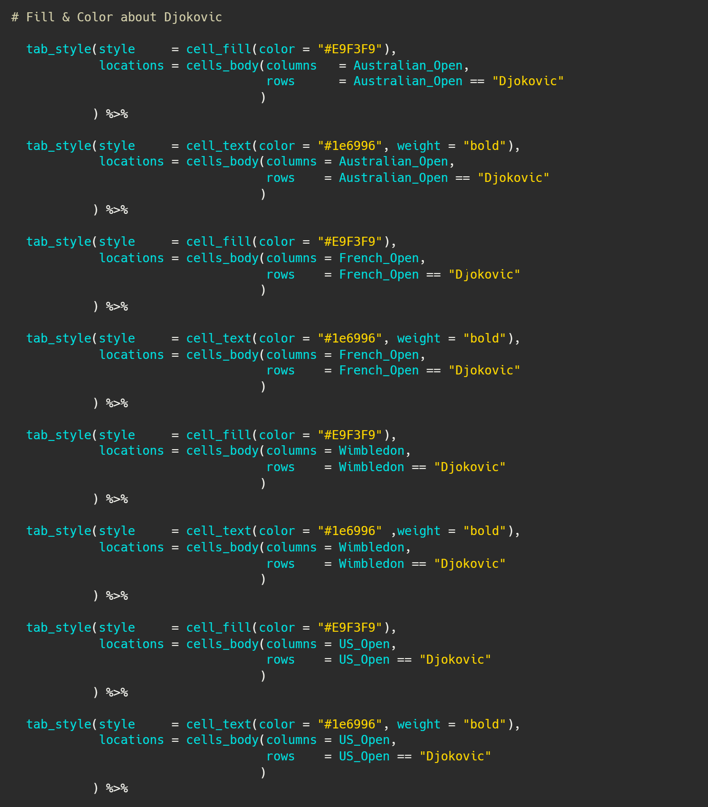
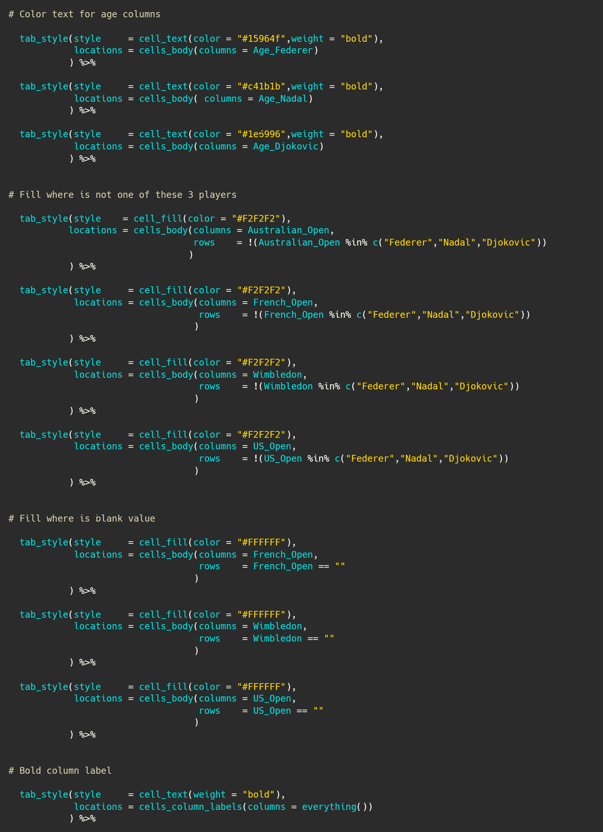
We get :

Agree ? 😊
You will find the code below by clicking the github link button.
 MaximeDeniaux
Thanks for reading! I hope it was clear and you liked it.
If you have any questions or remarks, I invite you to create an account (it's free) to write a comment, or simply to be notified of a new post in the future !
I would like to thank Lev Akabas for this great visual table inspiration.
See you soon for new content 👋
Comments ()