Distribution of the number of goals by match and scores
Hello !
Welcome to this 11th football post. For better visibility, I advise you to look at my posts on a computer (for the size but also because the colors differ on a phone that has a dark theme like me. If the theme is light, only the size makes it difficult to read).
Today, a dataviz on the distribution of the number of goals by match and scores in the 5 major leagues between 1995 and 2020.
In the previous post, we saw the distribution of types of playing systems by league. It seemed interesting to me to continue on this path of comparison.
So I decided to tackle the theme of goals and scores this time.
Which championships have the most goals on average ? Has there been any evolution over the last 25 years ? What are the most frequent scores over this period ?
Visually, I was inspired by 2 graphs : The Global Decline in Consumer Confidence by Gilbert Fontana and Percentile Radars/Pizza’s by Getting Blue Fingers.
Here is the result (you can check the image with better resolution on my github especially for small details):
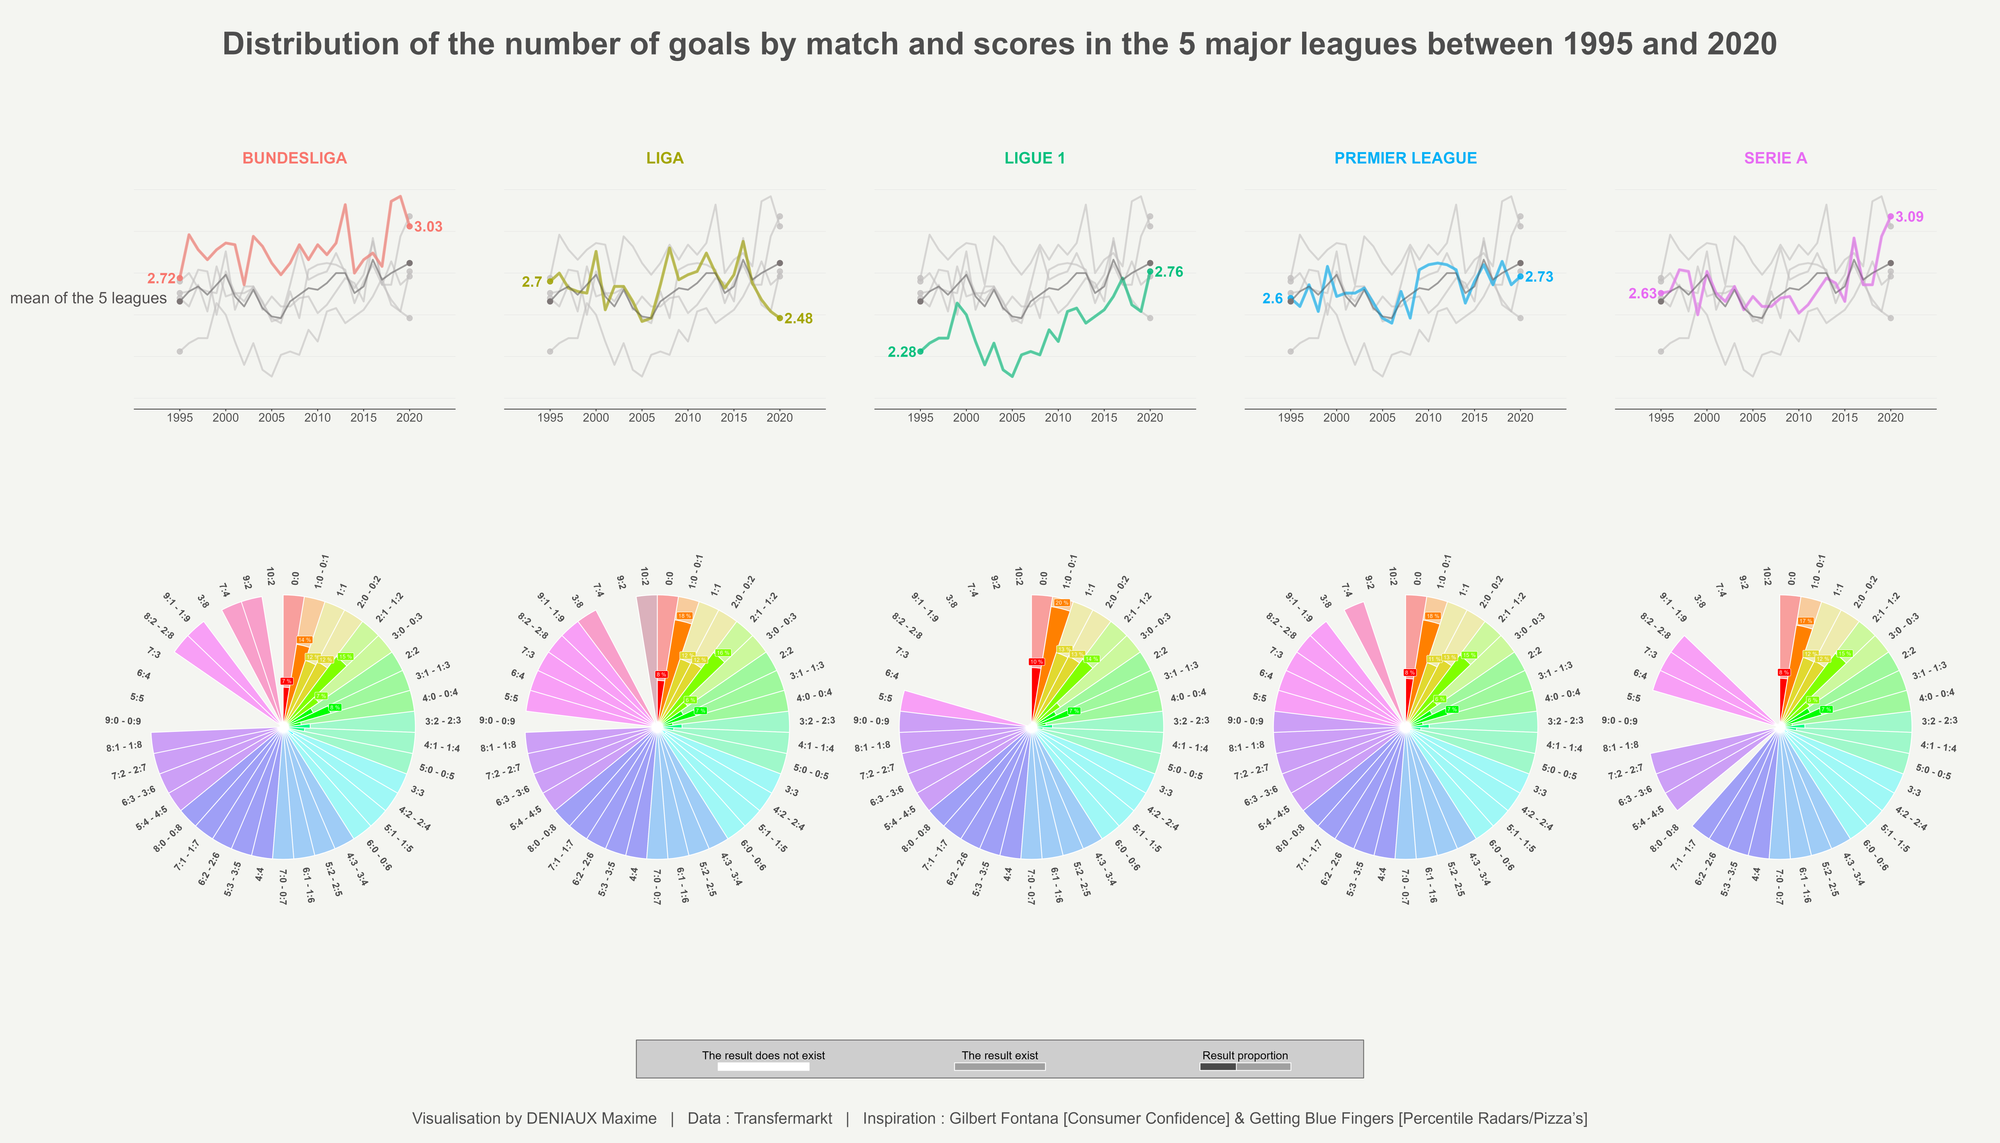
Each color of the pizza chart corresponds to a different number of goals in the match. Reading is done clockwise. So that goes up to 12 goals.
Now that that is said, a few words about dataviz analysis.
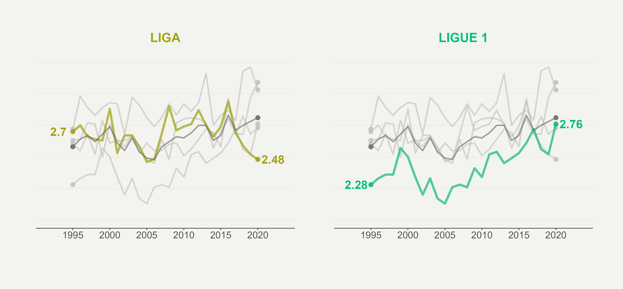
The Bundesliga has the reputation of being a championship with open play and spectacle. We observe that since 1995, it is this league which has the highest mean value of goals by match (2.90) with even a rather positive trend.
The Premier League remained very stable in this aspect (2.65). La Liga and Serie A are very similar, but have been distinguished since 2015 by two opposing trends. Indeed, one had a great decline and the other a great growth.
Finally, Ligue 1 is probably the one which has had the most notable change with regular growth.
As a Frenchman, I am delighted to see that the number of goals by match is increasing in our league. This probably makes it more attractive, because as spectators, we prefer to see goals...!
Concerning the scores, it turns out that regardless of the league, the most observed are the same (which is not surprising). But the proportions differ little, which I didn't initially expect. We can still note that scores 0-0, 1-0 and 0-1 are rarer in the Bundesliga, which is in line with what was said before. As well as a very volatile score diversity following the league.
Thanks for reading ! I hope it was clear and you liked it.
You will find the code below by clicking the github link button.
If you have any questions or remarks, I invite you to create an account (it's free) to write a comment, or simply to be notified of a new post in the future !
See you soon for new content 👋
 MaximeDeniaux
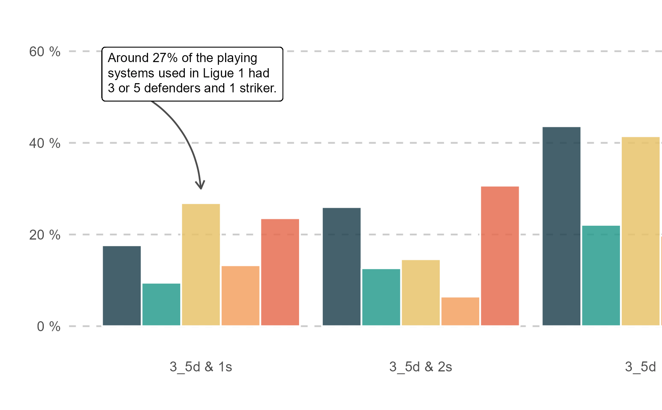
Comments ()