Top 30 ATP - Indicators evolution since 2000
Hello,
Welcome to this second tennis post. For better visibility, I advise you to look at my posts on a computer (for the size but also because the colors differ on a phone that has a dark theme like me. If the theme is light, only the size makes it difficult to read).
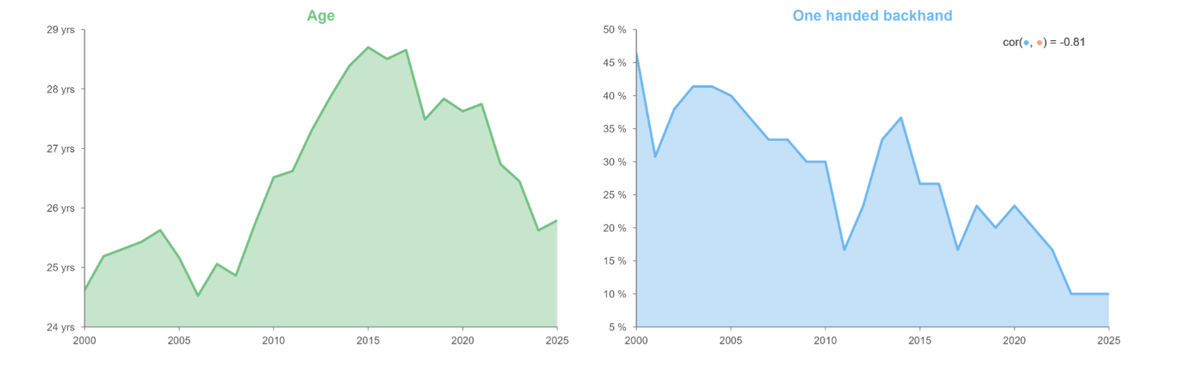
So, today's post is about the evolution since 2000 of different indicators in the ATP top 30. These indicators are the average age, the proportion of one-handed backhands, the average height, and the average number of aces per match.
So here is the evolution of these 4 indicators !
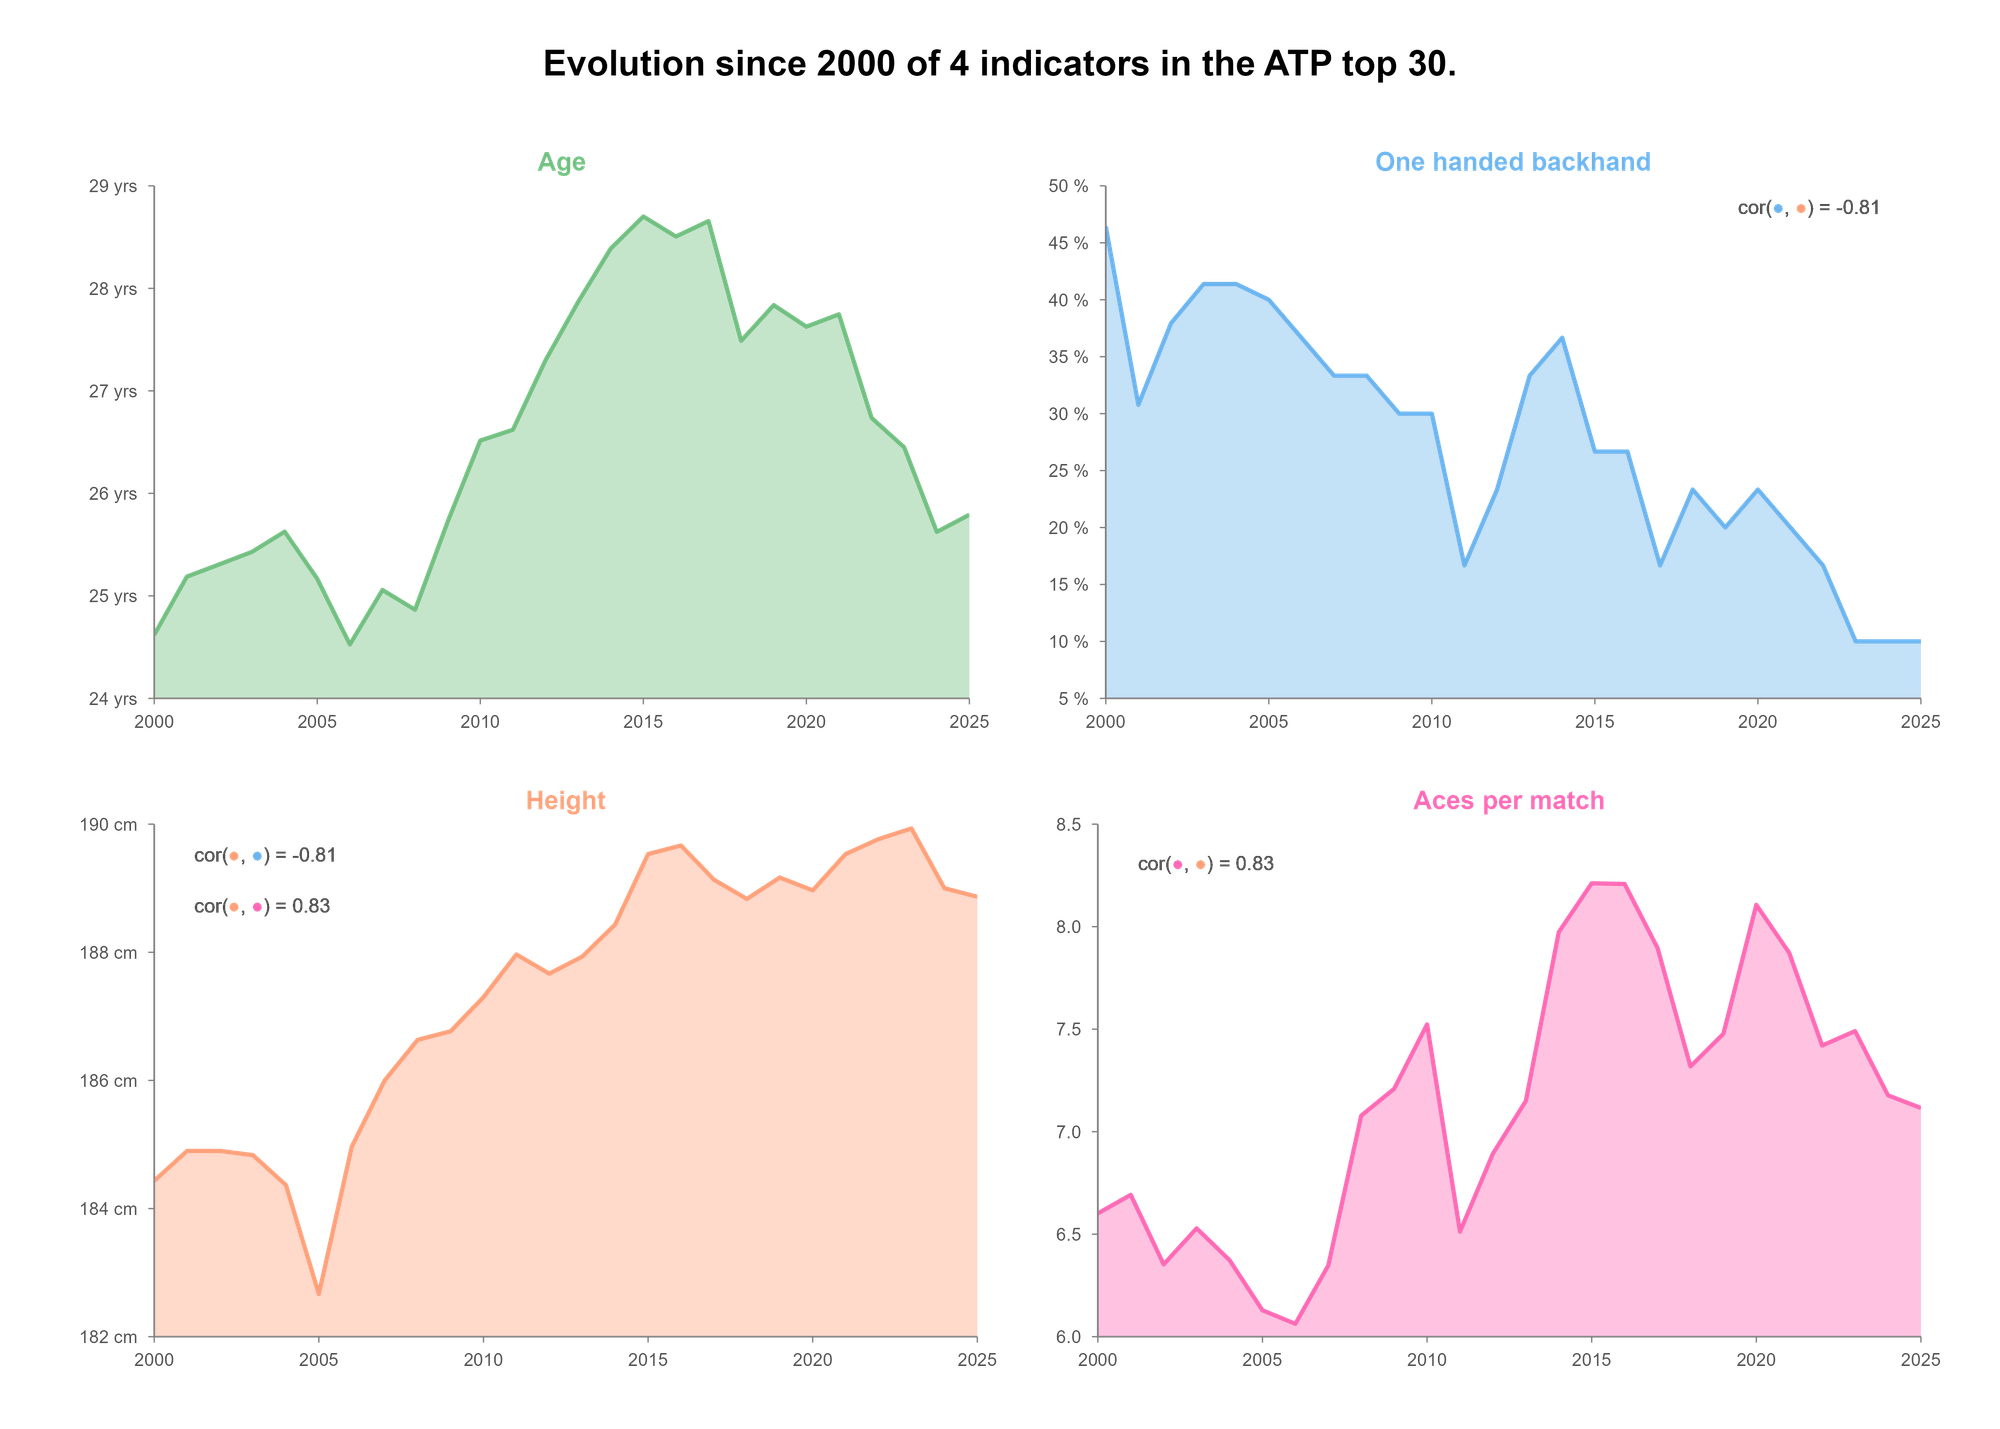
In my opinion, the evolution of the average height and the proportion of one-handed backhands is very revealing of the change of era within the very high level of this ATP tour. The profile of the players has changed over the last 25 years and has seen the emergence of true athletes with ever more impressive builds. This has also resulted in a change in the style of play employed in the top 30. We are increasingly dealing with players whose main weapons are power, with a big serve and a big forehand where the objective is to get the point in a minimum of strokes. Player training seems to have become standardized in this way.
The strong negative correlation between height and one-handed backhands (r = -0.81) is particularly striking: as players got taller, the one-handed backhand almost disappeared from the top 30, dropping from around 40% in the early 2000s to barely 10% today. Taller players also serve more aces (r = 0.83), which reinforces this picture of a tour shaped by power and physicality.
The increase in average age can probably be explained in large part by the longevity of the Big 3 (Djokovic, Nadal, Federer) at the top of the rankings. However, the recent decline after 2020 reflects the retirements of Federer (2022) and Nadal (2024), as a new, younger generation is finally taking over.
Finally, the aces per match indicator, which replaced the proportion of left-handers from the original version of this post, adds a nice layer to the analysis. It peaked around 2015-2018 alongside the height increase, before slightly declining in the most recent years.😊
You will find the data below by clicking the github link button.
 MaximeDeniaux
Thanks for reading ! I hope it was clear and you liked it.
If you have any questions or remarks, I invite you to create an account (it's free) to write a comment, or simply to be notified of a new post in the future !
See you soon for new content 👋
Comments ()