Build a touchmap
Hello,
Welcome to this first football post. For better visibility, I advise you to look at my posts on a computer (for the size but also because the colors differ on a phone that has a dark theme like me. If the theme is light, only the size makes it difficult to read).
It will consist of learning how to build a touchmap. For people who don't know what it is: a touchmap (in the context of football) or more generally called a heatmap, is a graphic representation that maps the intensity of a variable quantity to a color range on a two-dimensional matrix (which can itself represent a geographical area). Here, it is therefore a question of visualizing the activity of the players on the field through their touches of the ball during a match.
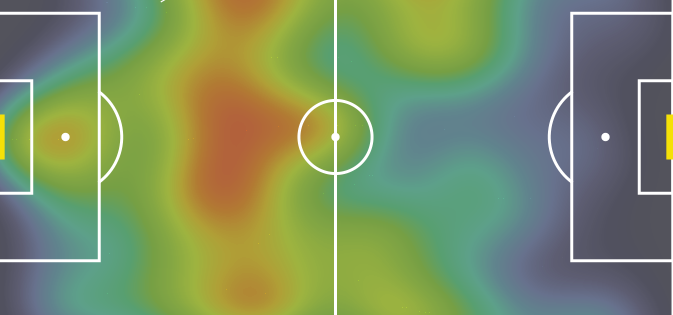
Below, 2 examples that I could quickly find on the web :
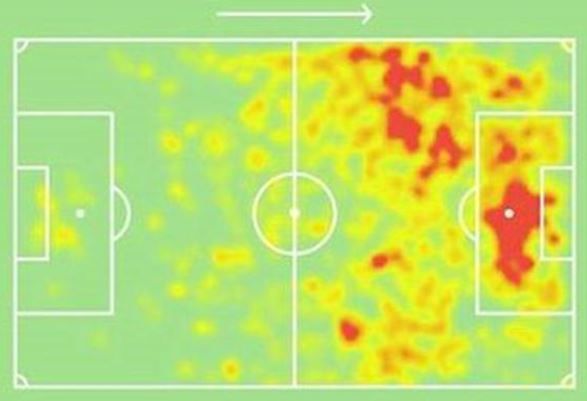
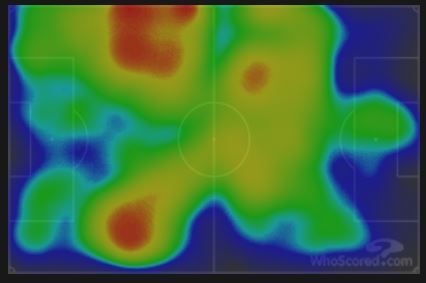
Sources :dreamteamfc.com / whoscored.com
Without delay, we will therefore try to build our own touchmap, with R !
Access to the code at the bottom of the page.
Let's go ! 😇
First, the data. We will use those kindly shared by Sonofacorner.
This is the Brighton vs Leicester match, September 4, 2022.
Two solutions (both through his github) :
- Download data directly with R via an URL.
- Download manually with the download button on his github page and put the file in our folders somewhere then import the file in a "classic" way.
Also be careful about the package used, because it can impact the structure of the file once imported. Here we will use the jsonlite package rather than RSJONIO. The structure will be easier to handle.
For this, we will use the package jsonlite as below :
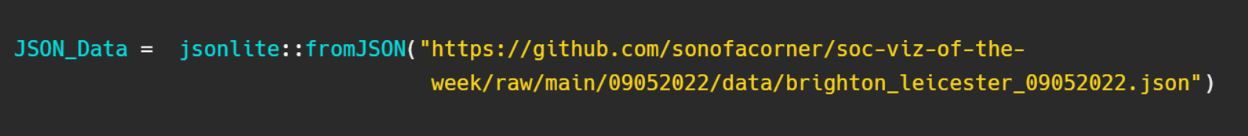
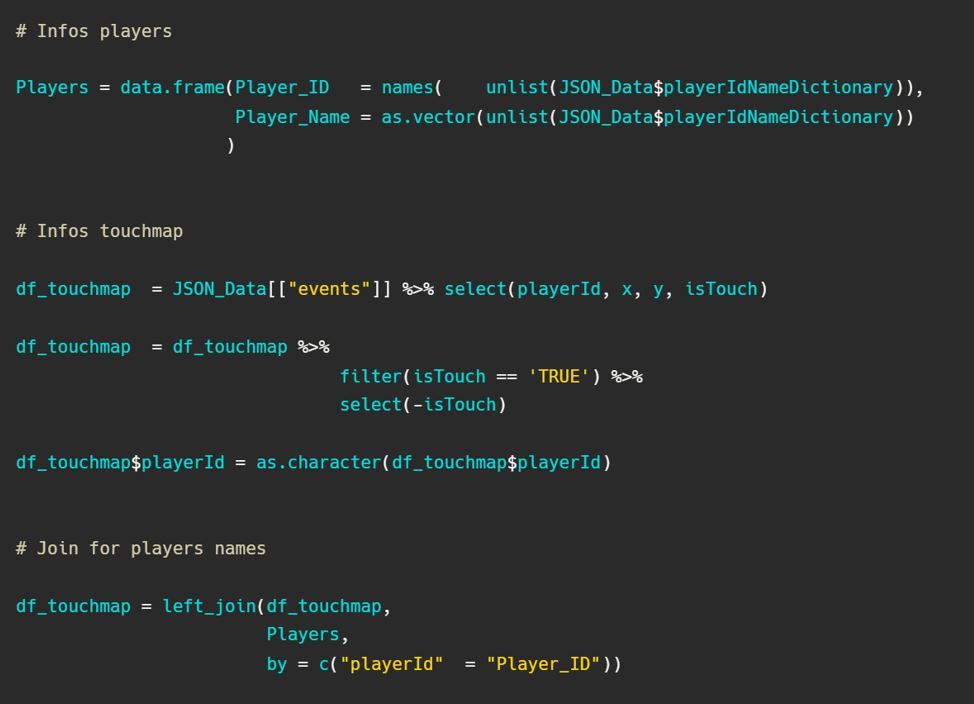
The import creates an object (JSON_Data) which is in fact a list of elements (here: 28 elements). This list contains a substantial amount of miscellaneous information, and in particular two, named 'events' et 'playerIdNameDictionary'.
Using these two elements, we will create a dataframe containing the x and y positions of each ball touch of each Brighton players during the match :
We have the data...but we are missing a pitch ! 🙁
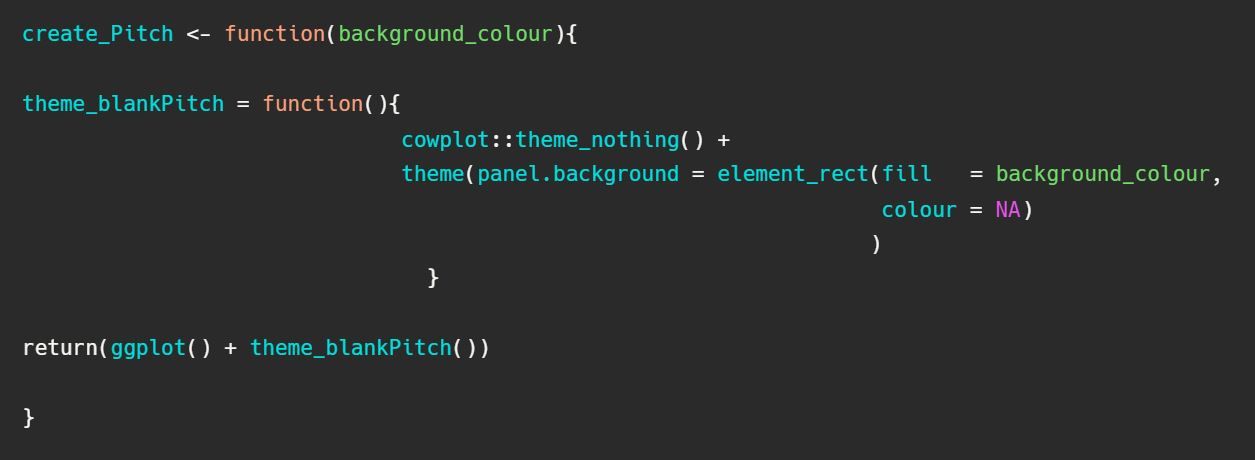
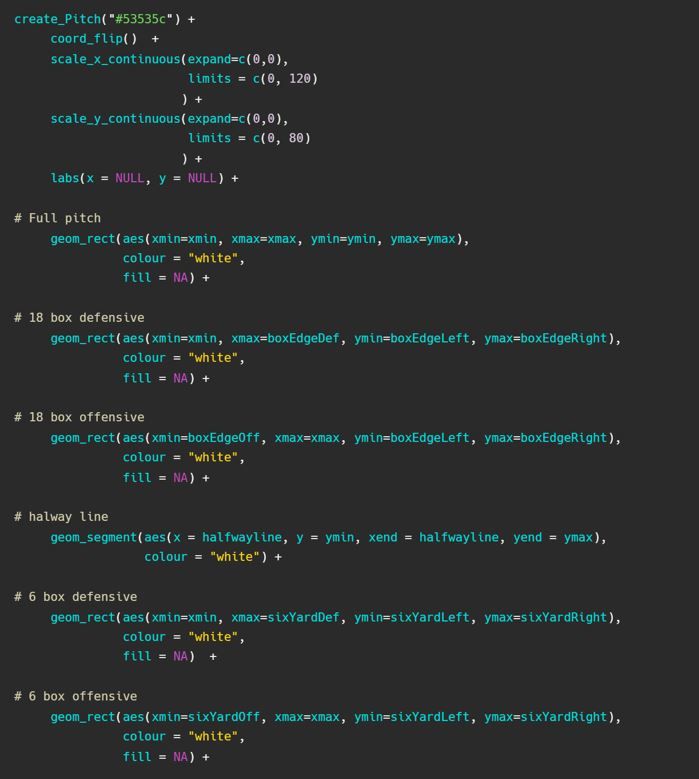
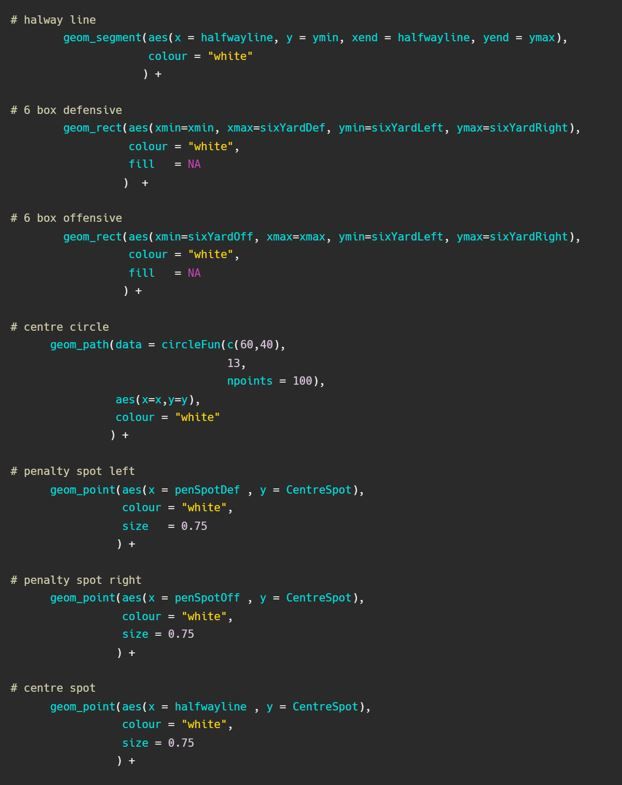
To build a pitch, you will have to create a ggplot() object that will contain...nothing. It is then that we will add each line step by step to draw this pitch.
At first, we build a generic function which allows the display of this "vacuum" :
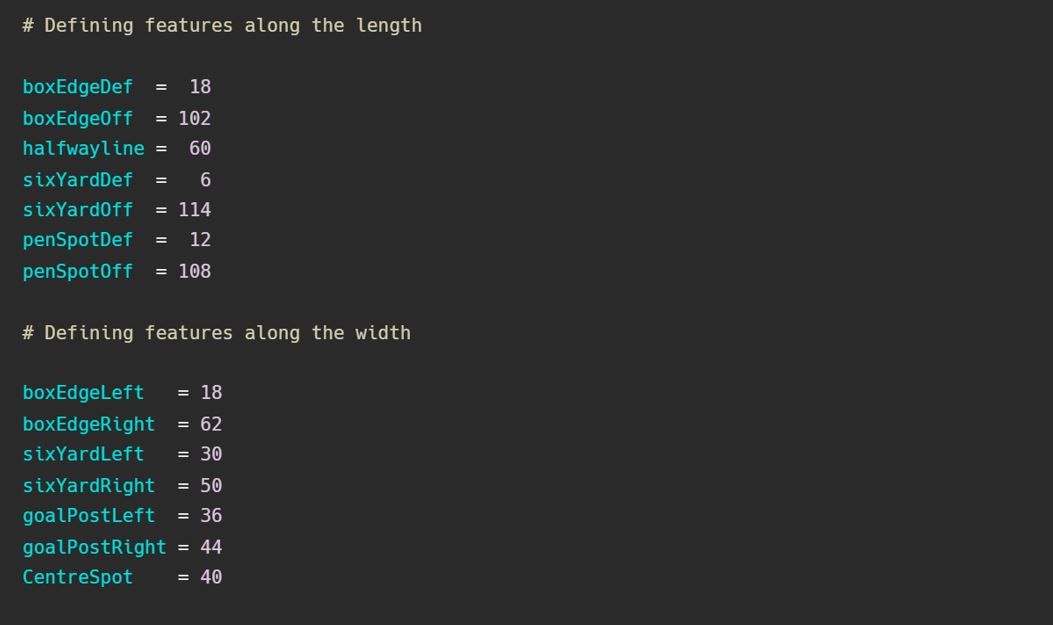
In order to add each pitch element step by step, it is necessary to know the specifications of a pitch (coordinates).
To do this, we can use information from StatsBomb.
Thus, we can write :
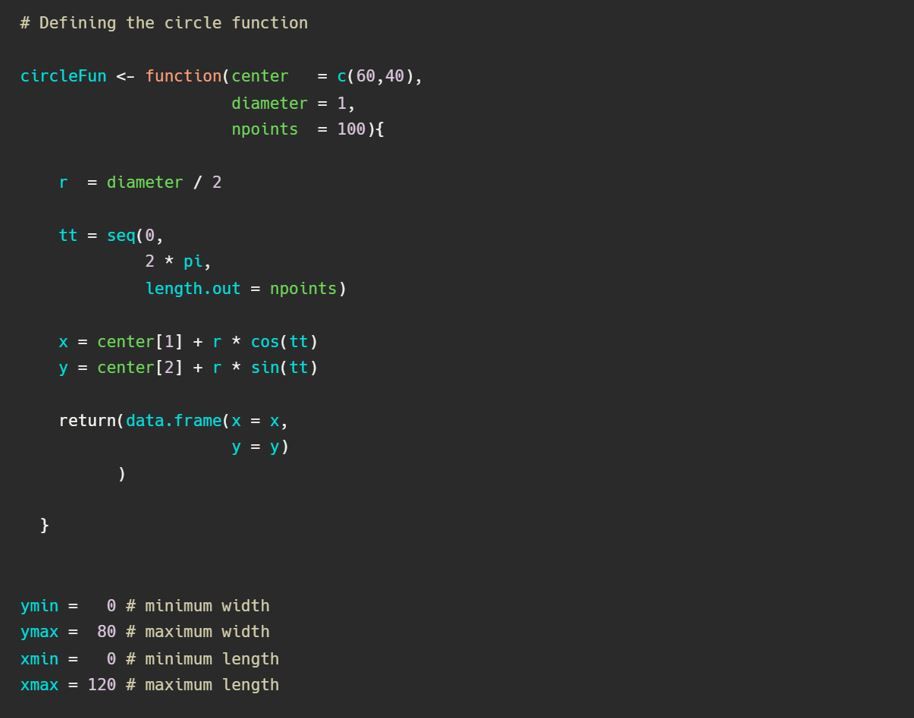
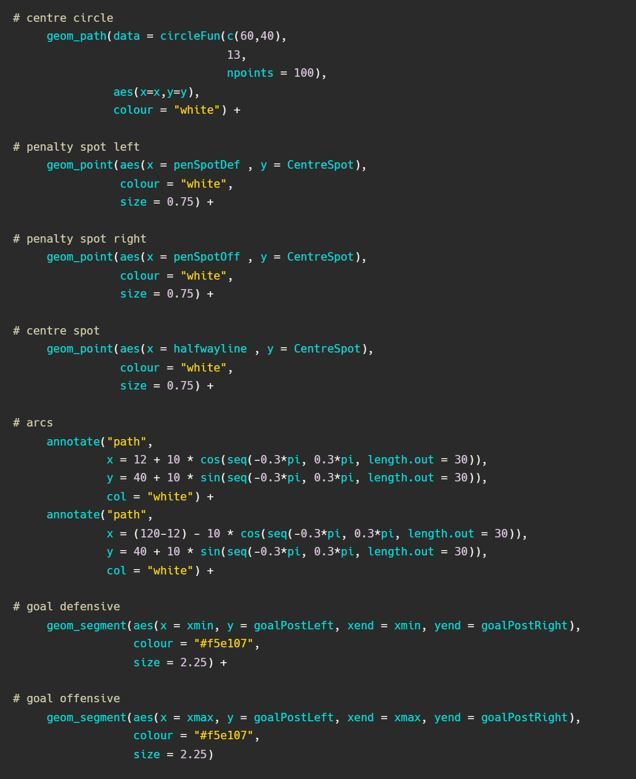
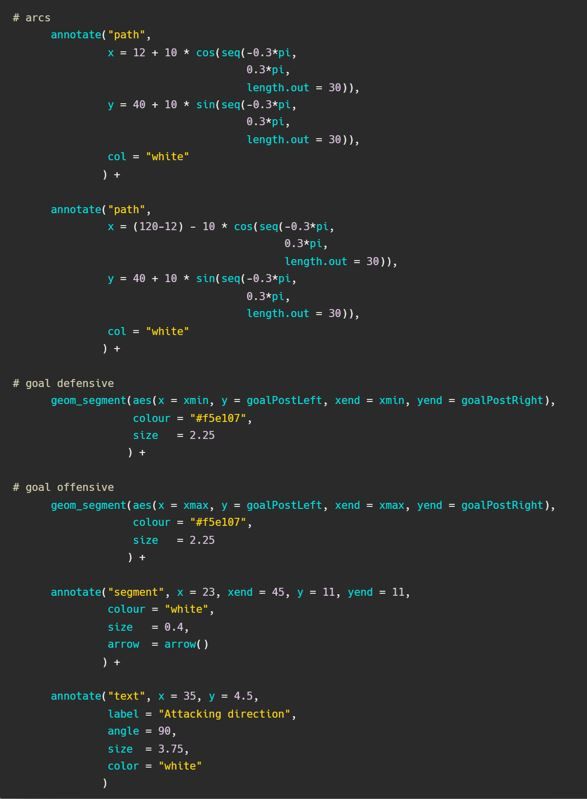
You must also draw the central circle, and give the dimensions of the pitch:
Now we can draw our pitch step by step !
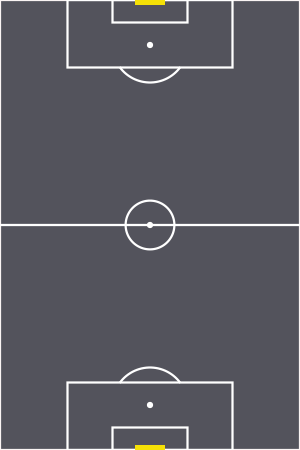
And here is our pitch! All that remains is to create the heat zones.
We will select a player, create a color palette and use the geom_density_2d_filled function to create these areas.
It is nevertheless necessary to modify the coordinates of the dataframe, because our pitch is in 120x80, but the values of the dataframe are according to a pitch of 100x100.
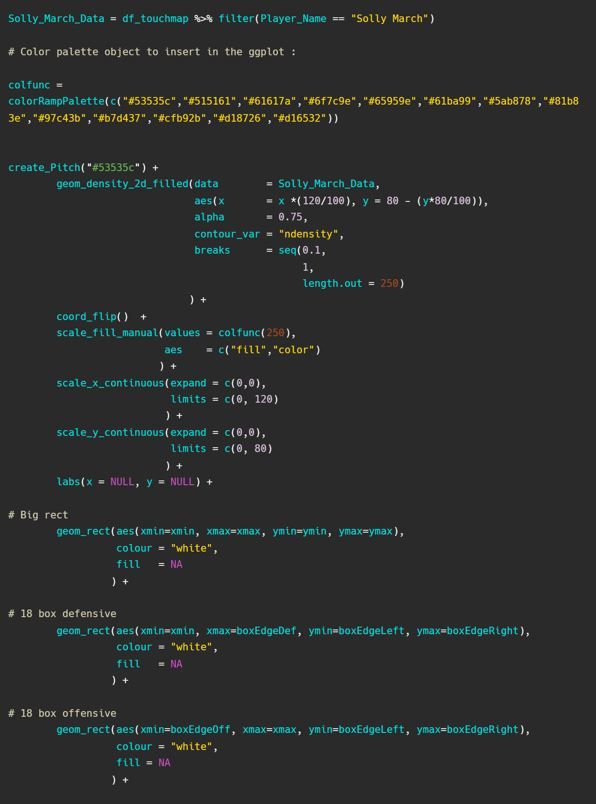
Here's the result ! Apparently, Solly March touched the ball a lot in the right attacking corner ! 😅
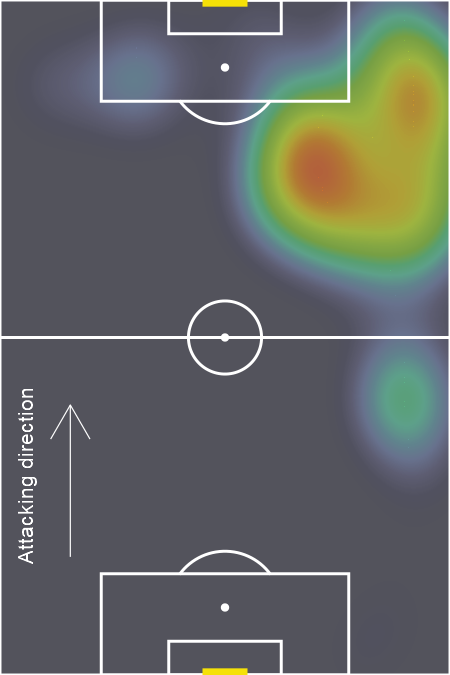
It seems less provided than the 2 examples seen at the beginning, but this can depend on several parameters, such as the statistical technique used for the heat zones, the color palette, whether it is a player or a whole team. For example, keeping our code but changing the data argument (i.e. writing df_touchmap instead of Solly_March_Data) we get :
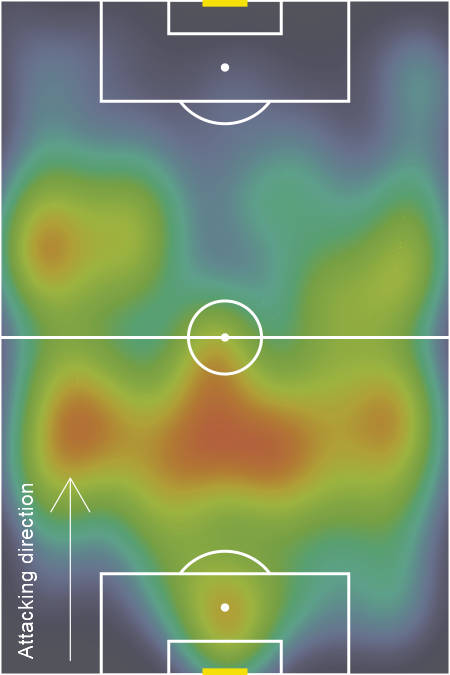
If you only want to have points and not heat zones, just replace the geom_density with a geom_point...
You will find the code below by clicking the github link button.
 MaximeDeniaux
Thanks for reading! I hope it was clear and you liked it.
If you have any questions or remarks, I invite you to create an account (it's free) to write a comment, or simply to be notified of a new post in the future !
I would like to thank once again Sonofacorner for the data, but also fc_rstats for his tutorial on creating a pitch (which I didn't keep everything because I think there are unnecessary things!)
In the next posts on football, we will see in particular how to combine several touchmaps into a single graph, by adding annotations such as flags (see the sonofacorner graph), how to recover this type of data via webscraping...and many more other things.
See you soon 👋
Comments ()