Two decades of French sports: who's winning the popularity race?
Hello !
Welcome to my third post on the 'other' page. For better visibility, I advise you to read my posts on a computer (for the size but also because the colors differ on a phone that has a dark theme like me. If the theme is light, only the size makes it harder to read) and on my website (if you are reading this from the newsletter) by clicking just above on "View in browser", rather than directly from the email.
France is home to over 120 accredited sports federations, collectively delivering millions of annual licenses. But beneath this aggregate figure lies a fascinating story of shifting preferences, generational trends, and external shocks. Which sports are gaining ground? Which ones are fading? And how has the landscape evolved for women in sport?
To answer these questions, which were inspired by my friend Romain, to whom I dedicate this post, I built an interactive visualization exploring 22 years of French sports license data (2002–2024), covering the 19 largest single-sport federations.
The data
The dataset comes from INJEP-MEDES (Institut National de la Jeunesse et de l'Éducation Populaire), the French government's statistical body for youth and sports. Every year, they conduct a census of all licenses issued by accredited sports federations, broken down by federation, gender, age group, and region.
The data I used spans from 2002 to 2024 and includes two key dimensions: the total number of annual licenses per federation, and the share of female license holders. I focused on the 19 largest "single-sport" federations, excluding school-based, military, and multi-sport organizations to keep the comparison meaningful.
The full dataset is freely available as open data on the INJEP website.
Why this matters
Sports participation data is more than just numbers — it's a mirror of society. It reflects cultural trends (the rise of individual sports), media influence (World Cup effects on football and handball), demographic shifts (an aging population gravitating toward hiking and golf), and of course, the massive disruption caused by COVID-19.
What makes this particular dataset compelling is its depth: 22 consecutive years allow us to distinguish genuine long-term trends from short-term noise.
The visualization
I built three interactive charts, each telling a different part of the story. The full interactive version is available here.
Below you will find a few words of analysis from me. But first, I'll let you take a look at the different windows, each containing a data visualization (on the first one, you can hover your mouse over a line to view it individually, on the second, scroll down to see each plot).
Ranking: how the hierarchy has shifted
The first chart is a bump chart tracking each sport's rank by number of license holders from 2002 to 2024.
Football and tennis have held the top two spots for the entire period — no surprise there. But below that, the reshuffling has been dramatic.
The biggest climbers include athletics (from #15 to #11), handball (#8 to #5), swimming (#12 to #9), and shooting (#17 to #14). Handball's rise is particularly striking — fueled by repeated international success (the French men's team won the World Championship in 2001, 2009, 2011, 2015, and 2017), the federation nearly doubled its license count from 319k to 591k.
On the declining side, pétanque suffered the steepest fall, dropping six places from #6 to #12. Once one of France's most popular federated sports, it lost over 100,000 license holders — a 27% decline. Judo dropped from #3 to #6, and sailing from #9 to #13.
The COVID-19 period (2020–2021) created temporary chaos in the rankings, but most sports returned to their pre-COVID trajectory by 2023–2024.
Growth: the full picture
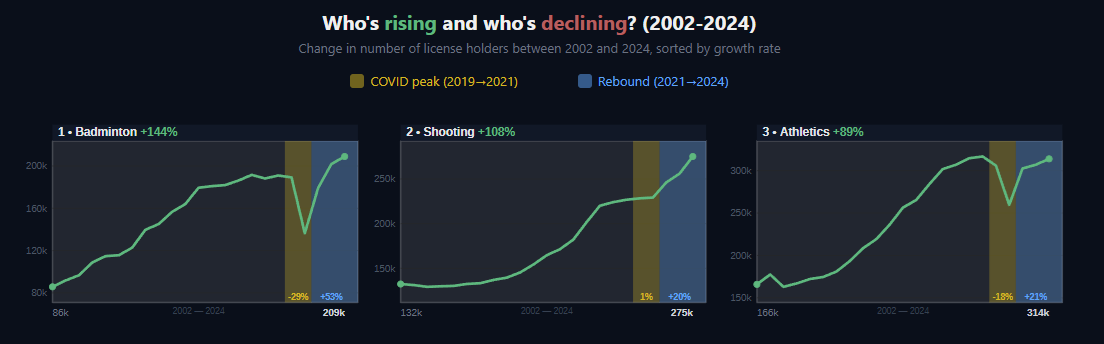
The second chart zooms in on the actual numbers. While the ranking chart shows relative positions, this one reveals the absolute growth (or decline) of each sport.
The standout performers are badminton (+144%, from 86k to 209k), shooting (+108%, from 132k to 275k), and athletics (+89%). These are sports that have consistently grown over two decades regardless of external factors.
At the other end, pétanque (-27%), judo (-5%), and table tennis (-2%) are the only federations that ended the period with fewer members than they started with.
The COVID impact was highly uneven. Karate lost 32% of its members between 2019 and 2021, while shooting barely noticed (+1%) and horse riding actually grew (+8%) — likely because outdoor and individual activities were less affected by social distancing restrictions. The rebound was equally varied: volleyball bounced back the strongest (+87% from 2021 to 2024), while horse riding and golf saw minimal recovery because they hadn't dropped much in the first place.
Feminization: progress, but uneven
The third chart tracks the share of female license holders in each federation, comparing 2002 and 2024.
The most dramatic shift happened in sailing, where women went from 17% to 37% of all members — a 20-point jump. Athletics nearly reached parity, moving from 36% to 48%. Traditional bastions of masculinity like football (2.3% to 10.5%) and rugby (2.5% to 13.7%) have made visible progress, even if the absolute numbers remain low.
Judo saw a notable rise from 24% to 34%, and karate from 27% to 37%.
But feminization is not a universal trend. Basketball actually lost ground, dropping from 40% to 35% female — one of the few sports where the gender gap has widened. Tennis (-3.3 points), golf (-3 points), and badminton (-3.9 points) also saw slight declines in their female share.
Sports that were already heavily female-dominated — horse riding (86%) and gymnastics (85%) — continued their trend, raising the question of whether these federations risk becoming gender-imbalanced in the other direction.
Swimming remained perfectly stable at 55%, the closest any major federation gets to true parity.
Beyond the numbers: why feminization matters
These numbers are not just about sport — they carry real public health and social significance. In France, 70% of women fall below the recommended physical activity thresholds for maintaining good health, compared to 42% of men (ANSES, 2024). At the global level, the WHO reports that physical inactivity remains more prevalent among women (34%) than men (29%), with consequences extending well beyond fitness: increased risk of cardiovascular disease, type 2 diabetes, dementia, and certain cancers (WHO, The Lancet Global Health, June 2024). Every percentage point gained in female sports licensing represents thousands of women gaining access to structured physical activity — and the health, social, and empowerment benefits that come with it.
The progress seen in football (2.3% to 10.5% female) or rugby (2.5% to 13.7%) didn't happen organically. It was the result of deliberate institutional strategies. The FFF launched its first feminization plan in 2011, when only 51,000 women held licenses, setting a target of 100,000 — a figure that has since been largely exceeded. The 2019 Women's World Cup in France served as a major catalyst, with a legacy budget exceeding €16 million invested by the FFF and FIFA to develop infrastructure and training (Rapport du Sénat, « Vive les footballeuses ! », 2019). The lesson is clear: feminization doesn't advance on its own momentum. When federations invest — through dedicated plans, media exposure, and role models — numbers move. When they don't, progress stalls or even reverses, as the slight declines in basketball, tennis, and badminton suggest.
The COVID-19 period added a gendered layer to this story. According to the Baromètre sport-santé of the FFEPGV in partnership with Ipsos, 67% of women reported greater difficulty maintaining physical activity during lockdowns and curfews. During the pandemic, women experienced more sedentary behavior, limited home-office space, and the accumulated burden of household and childcare responsibilities (Baromètre national des pratiques sportives, INJEP, 2023). While the post-COVID rebound has been strong overall — with female sports participation rising by 8 points between 2018 and 2022 according to the same INJEP barometer — this recovery hasn't necessarily translated into federated sports licensing, which depends on club-level capacity and outreach.
Finally, it's worth reflecting on sports where feminization has reached the opposite extreme. When horse riding sits at 86% female and gymnastics at 85%, the question is no longer just about "opening doors for women" — it's about whether these sports are inadvertently closing doors for boys and men. Gender stereotypes work in both directions.
Tools and methodology
This project was built entirely in R, using readxl for data import, tidyverse for data manipulation, ggplot2 for static charts, ggiraph for interactivity, ggtext for rich text formatting, and htmltools for assembling the final tabbed HTML page.
The ranking chart classifies sports as "Rise," "Stable," or "Decline" based on whether their rank improved, stayed the same, or worsened between 2002 and 2024. The growth chart uses the same logic but based on the percentage change in license numbers. The feminization chart categorizes sports based on the change in female share: any positive change is "Rise," any negative is "Decline," and exactly zero is "Stable."
The COVID peak period is defined as 2019–2021 (comparing pre-pandemic levels to the trough), and the rebound is measured from 2021 to 2024.
Thanks for reading! I hope it was clear and you enjoyed it.
You will find the code below by clicking the github link button.
If you have any questions or remarks, I invite you to create an account (it's free) to write a comment, or simply to be notified of a new post in the future !
See you soon for new content 👋


Comments ()